
**TL;DR**
Real estate has always been defined by timing, location, and access to information. The difference today is how that information is collected and used. Developers can gauge demand before construction. Agents can pinpoint undervalued neighborhoods. Banks can assess loan risk using live data instead of legacy records.
It’s not about replacing experience with statistics. It’s about pairing human judgment with evidence. Big Data gives real estate professionals a lens into market behavior that once took years to see. The result is faster insight, smarter investment, and fewer surprises.
The Current State of Real Estate Data in 2025
The best deals in real estate have always gone to the people who knew first. The agent who heard about a project before zoning approval. The investor who noticed migration toward an overlooked suburb. The developer who guessed where families would move next.
That advantage once came from personal networks and experience. Now it comes from data. In 2025, online listings, satellite imagery, IoT sensors, and social sentiment have turned real estate into one of the richest data ecosystems in business.
Real estate data analytics converts millions of these signals into usable intelligence. It reads listing history, rental yields, mortgage behavior, and public sentiment to show how and why people move. Combined with housing data scraping, this creates a constantly updating picture of demand.
With Big Data, a developer can map where renovation activity is rising. A property manager can predict price movement weeks ahead. A city planner can test how new infrastructure will change migration. The industry has moved from reactive reports to predictive awareness.
The Role of Big Data in Real Estate
Only a few years ago, analysis meant spreadsheets of sales records and a broker’s opinion. Now, Big Data blends multiple sources search trends, mobility statistics, zoning data, and even local reviews — to show how people truly value property.
| Data Source | What It Includes | Why It Matters |
| Public Records and MLS Databases | Ownership, taxes, sale history | Establishes legal and pricing baselines |
| Housing Data Scraping | Active listings, price adjustments, rental terms | Tracks live market movement |
| Demographic and Mobility Data | Income, migration, commute | Predicts where demand will rise |
| IoT and Building Sensors | Energy use, occupancy | Improves maintenance and tenant experience |
| Social Sentiment Data | Reviews, posts, discussions | Reveals perception and reputation |
A high sale price might look inflated until nearby transport upgrades are revealed through public data. A stagnant suburb might turn out to be quietly gaining population through migration analytics.
Big Data makes real estate reports dynamic. Dashboards update daily, not quarterly. Developers can test pre-launch demand. City planners can visualize congestion before it happens. Decisions shift with the market instead of trailing behind it. When numbers gain context, they turn into stories. Connecting social reviews, listings, and rental data shows how communities evolve. It lets investors predict, not just follow.
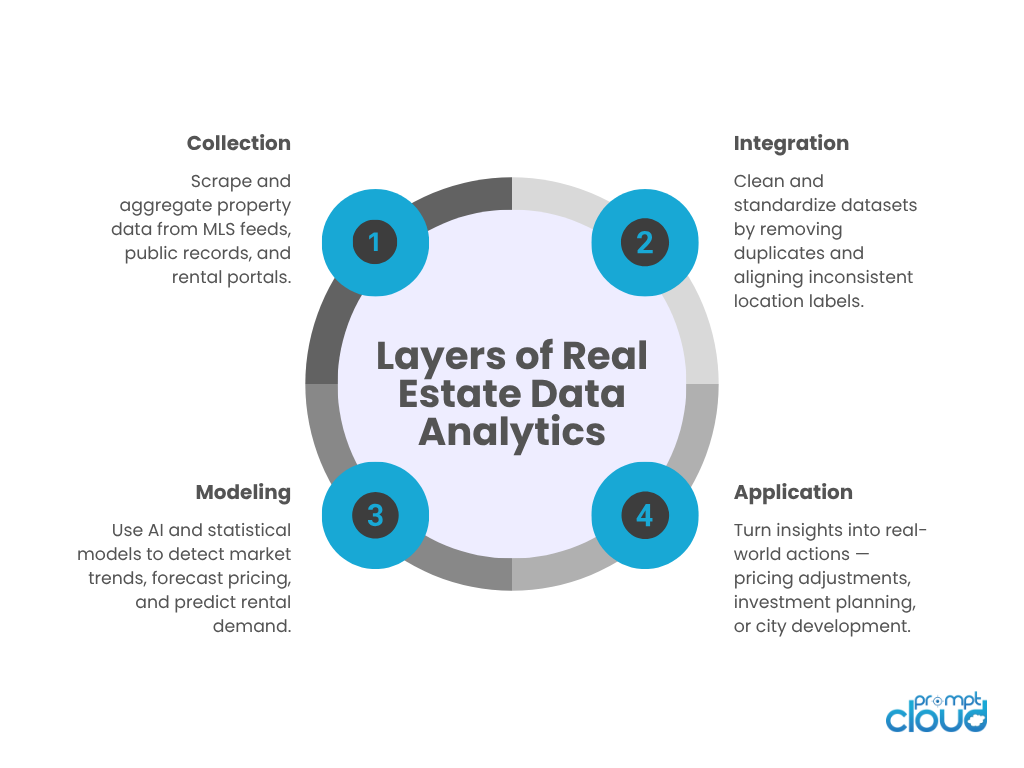
Figure 1: A four-step circular process showing how property data moves from collection to decision-making in real estate analytics.
From real-time behavioral feeds to alt-data enrichment plus automated decision loops, we do it all. Schedule a demo to see how you can turn datafication into a competitive advantage.
What are the Benefits of Real Estate Data Analytics
1. Smarter Investment
Each property is a record of behavior prices, renovations, demographics, and sentiment. Analytics processes those patterns at scale. Investors can screen thousands of listings, rank risk, and predict value growth with machine learning models. A simple dataset scraped from MLS listings can reveal zones where listings sell faster and where rental discounts are narrowing. Those micro-signals indicate rising demand long before official reports.
2. Accurate and Adaptive Valuation
Traditional valuation depends on human judgment. Big Data adds measurable precision. Automated valuation models combine sales history, local development, and demand indicators to adjust prices daily. If new restaurants or schools appear nearby, the system updates estimated value automatically. For lenders, that means better collateral accuracy. For sellers, fairer pricing.
3. Precision Marketing for Agents
Analytics turns mass marketing into personal outreach. By studying browsing and inquiry behavior, agents can target buyers by timing and interest rather than geography alone.
5. Risk and Fraud Detection
AI models flag real estate anomalies automatically, saving lenders and buyers from costly mistakes. For investors, this means safer deals. For banks, lower default risk. For regulators, early detection of inflated markets.
6. Planning Sustainable Cities
Governments and developers rely on aggregated property data to build smarter. IoT sensors, zoning databases, and population maps show where housing pressure will rise and where resources are under-used. Heat maps based on environmental data help direct development toward greener, more efficient spaces. The result is cities built with foresight rather than reaction.
7. Transparent Markets
Perhaps the biggest human benefit is clarity. Buyers can verify data themselves, and sellers can measure demand before listing. Everyone sees the same reality. This transparency reduces misinformation and emotional pricing, improving trust across every transaction.
How Real Estate Data Analytics Works
Behind every dashboard lies a pipeline: collecting, connecting, and interpreting.
1. Data Collection
When thousands of records are merged, market movement becomes visible.
| Data Type | Example Fields | Typical Source |
| Property Data | Price, area, amenities | MLS, portals |
| Transactions | Sales, ownership history | Public records |
| Demographics | Age, income, mobility | Census, mobile data |
| Rentals | Lease terms, vacancy | Marketplaces, scraped feeds |
| Sentiment | Reviews, trends | Social platforms |
2. Data Integration
Each dataset arrives in a different format — JSON, CSV, PDF — and must be cleaned and standardized. Duplicate entries are removed, and ambiguous locations are aligned. “SoHo” and “South of Houston Street” become one entity. Unified data creates the foundation for analysis. Many enterprises use managed scraping frameworks that maintain these pipelines automatically, ensuring continuous updates from MLS and internal CRMs.
3. Interpretation and Modeling
With clean data, analysts or AI systems start asking questions:
- Which areas are appreciating fastest?
- How do nearby amenities affect value?
- What is the probability a property sells in thirty days?
Models trained on historical MLS data reveal hidden correlations — for example, renovation permits and search activity rising together often precede a price jump. Dashboards convert these insights into simple visuals anyone can read.
4. The AI Layer
Artificial intelligence speeds and deepens interpretation. NLP models scan descriptions to detect tone and selling pressure. Vision models grade photo quality and presentation trends.
AI can also test scenarios: how rate hikes affect affordability or how new offices might change rental yield. With constant inputs from housing data scraping and real-time listings, predictions stay current.
5. From Insight to Action
Insights only matter when used. Firms act on data daily — adjusting prices, launching projects, or redirecting marketing.
A developer might pause construction if supply data shows saturation. An agent might shift focus to eco-friendly listings as searches for sustainable homes surge. Analytics turns raw numbers into confident decisions.
Applications Across the Industry
Investment and Lending
Investors use live dashboards to compare returns across portfolios, while banks use AI valuation to test collateral reliability. Predictive models highlight undervalued zones before they trend.
To keep data pipelines consistent, refer to how to fix web scraping errors in 2025 for methods that stabilize automated collection across property portals.
Development and Construction
Developers combine MLS data with demographic and land-permit scraping to select sites where population and infrastructure will support future growth.
Teams using automation adopt AI web scraping agents to keep feasibility studies updated without manual effort.
Marketing and Public Perception
Brand perception now shapes property value. Real estate analytics applies sentiment tracking to see how projects are discussed online. By comparing keyword trends like “traffic” or “safety,” developers can improve public engagement.
See how web scraping improves online reputation management for examples of sentiment analysis applied to real estate marketing.
Smart Cities and Urban Policy
Urban planners use predictive analytics to plan infrastructure and prevent congestion before it starts. They simulate zoning impacts using Generative AI models similar to those in GenAI web scraping to test multiple city-growth scenarios.
Sustainability
Developers track carbon data from IoT meters to evaluate efficiency. These insights guide retrofits and help investors meet ESG targets. For builders, sustainability metrics are becoming as important as cost or size.
What will be the Future of Real Estate Analytics?
Real estate is moving toward continuous, predictive decision-making. AI will soon anticipate demand at the street level, merging economic, environmental, and behavioral data.
Generative models will simulate developments before a blueprint is drawn. Regulators will use the same datasets to ensure fair pricing and sustainability compliance.
The next edge will not come from owning property first but from understanding data faster. Those who build analytics pipelines today will define tomorrow’s property markets.
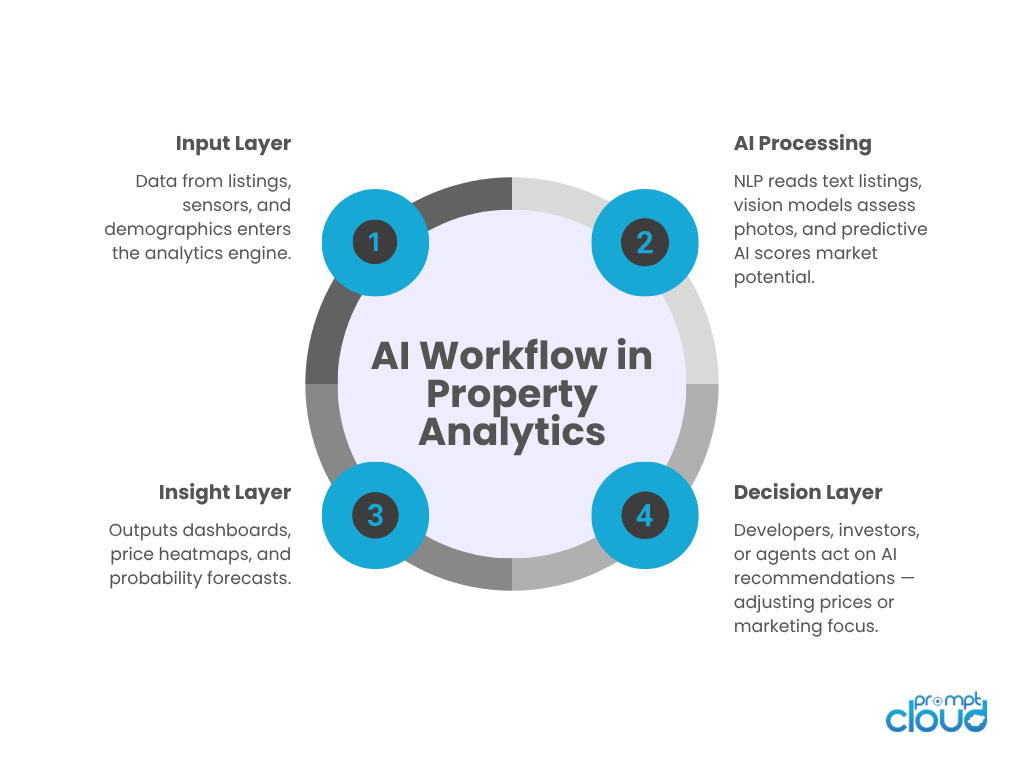
Figure 2: A circular flow chart showing how AI transforms raw housing and rental data into actionable insights for real estate professionals.
Practical Playbook for Teams Starting with Real Estate Data Analytics
You do not need a giant data team to get value. You need a small set of habits that you repeat until they become muscle memory. Think of the following as a starter playbook that any investor, brokerage, or developer can adopt in ninety days.
Week one. Define the question and the unit of analysis
Pick one sharp question. Examples. Which listings are priced ten percent above fair value this month. Which zip codes show the fastest rise in time on the market. Then pick your unit of analysis. A property. A block. A zip code. A building class. Clarity on the unit keeps your data pipeline focused and your dashboard simple.
Weeks two and three. Assemble only the data you need
Start with essentials. Listings, transactions, rental feeds, and a clean geography file. Add one external stream that moves often, such as search interest or new permit filings. Resist the urge to ingest everything.
Weeks four and five. Clean and normalize
This is the step most teams underestimate. You will find duplicate addresses. You will find missing lot sizes. You will find different spellings for the same neighborhood. Create simple rules. One address format. One canonical neighborhood name. One preferred currency. Create three validation checks that run automatically. Row count compared with yesterday. Percent of records with missing price. Percent of records with missing coordinates. When a check fails, stop the pipeline and fix the source.
Weeks six and seven. Build a first view
Do not aim for a perfect dashboard. Aim for a view that answers the original question. A simple map of median price by zip code over time might be enough. A line chart for time on market by building class might be enough. Add one filter at a time. Bedroom count. Year built. Transit distance.
Weeks eight and nine. Add a predictive hint
Now that the picture is stable, add a small model. It can be as simple as a logistic regression that predicts the chance a listing sells in thirty days. Or a price index that adjusts for property mix and seasonality. The goal is not fancy math. The goal is a hint that nudges someone to act sooner or think twice.
Weeks ten to twelve. Close the loop
Capture the actions that the dashboard influenced. Did the team change pricing in two neighborhoods? Did they shift and spend time in a different portal? Did they walk away from a site after the data raised a red flag. Add those actions to the dataset so that next quarter you can measure lift.
Common Pitfalls and How to Avoid Them
Chasing completeness instead of clarity. Teams try to collect every dataset they can find. The result is bloat with little impact. Anchor the work to one decision. Ask if each new column helps answer that decision.
Treating MLS feeds as perfect truth. They are not. Listing photos can mislead. Bed and bath counts can be inconsistent. Always compare with public record samples. Keep a small manual audit to calibrate your trust level.
Letting model scores stand alone. A probability looks scientific, but it still needs context. Pair each score with two or three explanatory features. For example, this listing has a high chance to sell quickly because it sits within eight minutes of a new transit stop, because the photo quality score is high, and because similar homes nearby closed with small discounts.
Ignoring data drift. Markets move. Pipelines break. The model that worked last spring can fail this winter. Schedule a monthly drift check. Refit when the accuracy dips below a line you set in advance.
Overlooking governance. Privacy and consent are not afterthoughts. Keep a single page that lists data sources, update frequency, retention policy, and who can access what. Share it with leadership. Good governance prevents surprises.
Field Vignette, A Quiet Suburb Turns
Here is a simple example of insight in action. A mid-sized developer watched a suburban pocket on the edge of a large metro. On paper, prices looked flat and inventory looked average. The dashboard told a different story. Search interest for that pocket climbed for three months in a row. Time on market fell by a week. Rental discounts narrowed even with winter seasonality. Permit filings for small renovations rose. Sentiment around a new elementary school was positive and steady.
Individually, none of those signals proved much. Together, they painted a clear path. The team secured two small parcels near the school and designed a modest townhome plan with three bedroom layouts and simple energy upgrades. They launched with a conservative price and scheduled open houses for the same weekend as a local sports event that drew families. The first phase sold out in two weeks. The second phase launched with a small price lift and similar momentum.
The lesson is not that sentiment alone wins or that permits alone predict demand. The lesson is that a handful of live signals, read together, beat a single quarterly report every time. The tools did not replace the developer’s feel for the area. They gave that feel real footing.
Pricing Analytics That People Actually Use
Pricing is where many teams want an instant answer, yet the best systems are simple and transparent. Start with three pillars. A fair value estimate based on comparable sales adjusted for property mix. A momentum factor based on listing velocity and discount depth. A presentation factor based on photo quality, description clarity, and amenity mentions.
Combine those pillars into a suggested price band, not a single number. Then track how the first two weeks of activity compare with expectation. If views and inquiries fall below your band, pivot early. If offers arrive faster than expected, move the next release window forward. Pricing becomes a series of small, informed moves rather than a single bet.
Bringing People Into the Loop
Data does not persuade on its own. People persuade. When you roll out analytics to agents or site teams, spend time on how to read the picture. Show two examples where the dashboard led to a better outcome. Explain one case where the model was wrong and how you corrected it. Keep the language ordinary. Avoid technical jargon. The faster people can relate the chart to their day, the faster they will use it.
The goal is not a perfect platform. The goal is a steady practice that helps real decisions, week after week. Start small. Keep what works. Retire what does not. Over time, your analytics will feel less like a project and more like the way your real estate business thinks.
From real-time behavioral feeds to alt-data enrichment plus automated decision loops, we do it all. Schedule a demo to see how you can turn datafication into a competitive advantage.
FAQs
1. What is real estate data analytics, really?
It’s the process of collecting, cleaning, and analyzing housing and property data to make better decisions. Think of it as using evidence instead of instinct — combining public records, scraped listings, and market signals to understand what’s actually happening before making a move.
2. How does AI improve property analysis?
AI brings speed and pattern recognition. It reads listing descriptions, compares images, and learns which features lead to faster sales or higher bids. Over time, it builds a kind of “market intuition” that complements human expertise rather than replacing it.
3. Where does all this property data come from?
Data comes from MLS feeds, rental platforms, government registries, and public websites. Housing data scraping automates the collection, while APIs and IoT sensors add live updates from buildings, traffic, and energy systems. Together, they create a real-time view of the housing market.
4. How can small real estate teams use analytics without huge budgets?
Start with what’s free and public. Basic listing data, census stats, and scraped rental information can reveal patterns when cleaned properly. Many modern scraping services now offer managed pipelines, so teams can access structured data without maintaining heavy infrastructure.
5. Will data analytics replace real estate agents?
Not at all. It gives them superpowers. AI handles the repetitive tasks price comparison, lead scoring, or market alerts while humans do what they do best: negotiation, trust, and storytelling. The best results come when data sharpens human judgment, not when it replaces it.