Big Data Visualization Tools for Businesses
Let’s say you are a proud owner of a gold mine but you can’t harness the gold from that mine. So, what’s the point in being the owner? Is there any? The condition is the same with big data. There is no point in collecting large chunks of big data if you fail to churn it and harness the information lying beneath it. To resolve this issue, data visualization tools are the exact weapons you need. These tools show us various insights into the collected data. Big names like Google and Microsoft collect and manipulate big data to design the future of their business strategies. Today, we will discuss some of these popular visualization tools for big data.
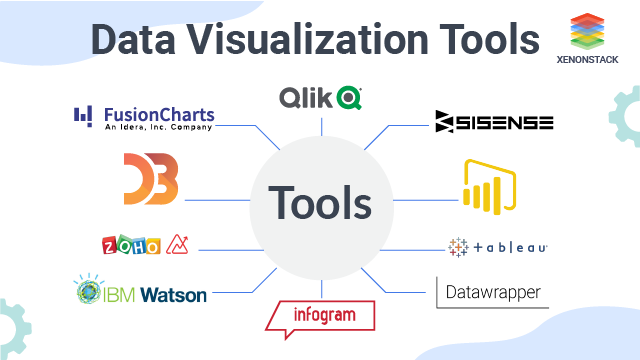
Image Source: https://www.xenonstack.com/
1. Google Chart
Google is an obvious benchmark and well known for the user-friendliness offered by its products and Google chart is not an exception. It is one of the easiest data visualization tools for visualizing huge data sets. Google chart holds a wide range of chart galleries, from a simple line graph to a complex hierarchical tree-like structure and you can use any of them that fits your requirement. Moreover, the most important part while designing a chart is customization and with Google charts, it’s fairly Spartan. You can always ask for some technical help if you want to dig deep. It renders the chart in HTML5/SVG format and it is cross-browser compatible. Added to this, it also has adopted VML for supporting old IE browsers and that’s also cross-platform compatible, and portable to iOS, and the new release of Android. The chart data can be easily exported to PNG format. Consequently, Google chart is quite efficient in handling real-time data. You can also endorse data from other Google products like Google Maps with your existing data to make an interactive chart and control them from an interactive dashboard. Furthermore, the service is absolutely free with strong Google support.
2. Tableau
Tableau desktop is an amazing data visualization tool (SaaS) for manipulating big data and it’s available to everyone. It has two other variants “Tableau Server” and cloud-based “Tableau Online” which are dedicatedly designed for big data-related organizations. You don’t have to be a coder to use this tool. This tool is very handy and provides lightning-fast speed. The canvas or dashboard is user-friendly and ‘drag and drop’ compatible, therefore, it creates a homely atmosphere in any working environment. You can connect all your data from as little as a spreadsheet to as big as Hadoop, painlessly, and analyze deeply. Tableau Desktop is free for students and instructors, otherwise, Tableau desktop charges $999 and $1999 for personal and professional editions respectively for 1 year with support. Read our detailed review of Tableau here.
3. D3
D3 or Data-Driven Document is a Javascript library for big data visualizations in virtually any way you want. This is not a tool, like the others and the user needs a good grasp of javascript to give the collected data a shape. The manipulated data are rendered through HTML, SVG, and CSS, so there is no place for old browsers (IE 7 or 8) as they don’t support SVG (Scalable Vector Graphics). It is not a monolithic framework that it has to seek for every opportunity, instead, it solves the problem from the crux. It allows you to bind arbitrary data with DOM (Document Object Model) and apply the data-driven transformation to the data with a smooth transition and animation effect (optional). D3 is extremely fast and supports large data sets in real-time. It also produces dynamic interaction and animation in both 2D and 3D with minimal overhead. The functional style of D3 allows you to reuse codes through the various collection of components and plug-ins.
4. Fusion Chart
Fusion chart XT is a Javascript charting library for the web and mobile devices, spread across 120 countries with clients such as Google, Intel, Microsoft, and many others. However, you need a bit of knowledge of Javascript for implementing it. Technically, it collects data in XML or JSON format and renders it through charts using Javascript (HTML5), SVG, and VML format. It provides more than 90 chart styles in both 2D and 3D visual formats with an array of features like scrolling, panning, and animation effects. It also provides 950+ maps of various places around the globe. Exporting charts is painless here, you can export any chart in PNG, JPG, or PDF format anywhere. Fusion Charts is available on Android, iPhone, iPad, MAC, and Windows. However, this tool doesn’t come for free. Its pricing range starts from $199 (for individual developers or freelancers) for one year and updates with one-month priority support.
5. Highcharts
Highcharts is a charting library written purely in Javascript hence, a bit of knowledge of Javascript is necessary for implementing this tool. It uses HTML5, SVG, and VML for displaying charts across various browsers (from IE6+) and devices like android, iPhone, etc. For any execution, it requires two .js files: the Highcharts.js core and jQuery or Mootools or prototype platform, which are mostly available on regular web pages. This tool also comes with a range of charts viz. line, bar, column, pie, etc. This tool is efficient enough to process real-time JSON data and represents them as a chart mentioned by the user. If you are an enthusiastic programmer you can download its source code and modify it as per your need. This tool is available for free to developers and the deployment price starts at $399. It has a huge client base which includes Facebook, Spandex, Visa, Nokia, and many more.
6. Canvas
Canvas.js is a javascript charting library with a simple API design and comes with a bunch of eye-catching themes. It is a lot faster than the conventional SVG or Flash charts. It also comes with a responsive design so that it can run on various devices like Android, iPhone, Tablets, Windows, Mac, etc. The chart gallery consists of 24 different types of charts but the USP is its speed. It can render 100000 data points in just 100 milliseconds. Therefore, if you are looking for a high-performance javascript chart, Canvas can be your best bet. It boasts of some business giants like Intel, Apple, Boeing, and EMC2 in its clientele. However, this tool is free for non-commercial usage.
7. Qlikview
Qlik is one of the major players in the data analytics space with their Qlikview tool which is also one of the biggest competitors of Tableau. Qlikview boasts over 40,000 customers spanning over 100 countries. Qlik is particularly known for its highly customizable setup and a host of features that help create the visualizations much faster. However, the available options could mean there would be a learning curve to get accustomed to the tool so as to use it to its full potential. Apart from its data visualization prowess, Qlikview also offers analytics, business intelligence, and enterprise reporting features. The clean and clutter-free user experience is one of the notable aspects of Qlikview. Qliksense is a sister package of Qlikview which is often used alongside the former to aid in data exploration and discovery. Another advantage of using Qlikview is the strong community of users and resources which will help you get started with the tool.
8. Datawrapper
Datawrapper is a data visualization tool that’s gaining popularity fast, especially among media companies that use it for presenting statistics and creating charts. It has an easy-to-navigate user interface where you can easily upload a CSV file to create maps, charts, and visualizations that can be quickly added to reports. Although the tool is primarily aimed at journalists, its flexibility should accommodate a host of applications apart from media usage.
9. Microsoft Power BI
Microsoft Power BI is a suite of business analytics tools from Microsoft primarily meant for analyzing data and sharing insights. It enables you to explore and dig insights out of your data via any device you use – desktops, tablets, or smartphones. It helps you derive quick answers from the data and also can connect to on-premises data sources for real-time mapping and analysis. Your data source or format won’t be a limitation with Power BI as it lets you connect hundreds of sources such as streaming data, data on cloud services, excel spreadsheets, and most other data file formats. Power BI is considered one of the best data visualization tools by industry experts and is being used across industries like finance, and sales to operations. For basic requirements, the tool can even be used for free as it lets you analyze up to 1GB of data per user account without a paid subscription.
10. Oracle Visual Analyzer
Introduced in 2015, this web-based tool within the Oracle Business Intelligence Cloud Service claimed a spot in the Magic Quadrant Business Intelligence and Analytics Platform report by Gartner. Interactive visuals and highly advanced analysis clubbed with a customizable dashboard are some of the key features of Oracle Visual Analyzer. Being highly scalable, this data visualization tool is very suitable for enterprises with large-scale deployments where deep insights and well-curated reports are essential. Every bit of data carries a story with it and these data visualization tools are the gateway to fathom the story it tries to tell us. It helps us to understand the current statistics and the future trends of the market.
Frequently Asked Questions
How do these big data visualization tools integrate with existing data management systems or databases?
Most big data visualization tools are designed to integrate seamlessly with existing data management systems or databases. They achieve this through APIs, direct connectors, or plugins, providing native support for a wide range of data sources, including SQL databases, cloud storage solutions, and NoSQL databases. This ensures users can easily import and synchronize their data for visualization.
What are the specific security features or protocols these tools offer to protect sensitive data during the visualization process?
Regarding security, these tools implement several measures to protect sensitive data. This includes encrypting data both in transit and at rest, ensuring that information remains secure during transfer and storage. They also offer role-based access control (RBAC) and authentication mechanisms to restrict access to sensitive data based on user roles. Furthermore, they comply with international data protection regulations, such as GDPR and HIPAA, to ensure user data privacy is maintained.
Can these big data visualization tools handle real-time data streaming, and if so, how do they manage the performance and latency issues associated with real-time data processing?
For real-time data streaming, big data visualization tools like Power BI and Oracle Visual Analyzer are capable of handling and visualizing data as it is generated. They address performance and latency issues through optimized data processing engines and offer the ability to adjust the granularity of data updates. This balance between providing real-time insights and maintaining system performance allows organizations to make timely decisions based on the latest data.
What are the data visualization tools?
Data visualization tools help in presenting data in graphical or pictorial formats, making it easier to analyze trends, patterns, and insights. Here are some of the most popular and widely used data visualization tools:
1. Tableau
- Overview: Tableau is a powerful, user-friendly tool that allows users to create interactive and shareable dashboards. It supports a wide range of data sources and provides advanced visualization capabilities.
- Key Features: Drag-and-drop interface, real-time data analysis, extensive dashboard creation, and integration with various databases.
- Best For: Businesses and data analysts who need to work with large datasets and create detailed visualizations.
2. Power BI
- Overview: Developed by Microsoft, Power BI is a business analytics tool that provides interactive visualizations and business intelligence capabilities. It integrates seamlessly with Microsoft services and offers a wide range of connectivity options.
- Key Features: Real-time dashboards, data collaboration, extensive data source connections, and integration with Microsoft Office.
- Best For: Users already in the Microsoft ecosystem, small to medium businesses, and enterprise-level reporting.
3. Google Data Studio
- Overview: Google Data Studio is a free tool that allows users to create interactive dashboards and reports with data from Google Analytics, Google Sheets, and other sources.
- Key Features: Free to use, Google ecosystem integration, customizable dashboards, and easy sharing.
- Best For: Small businesses and users needing Google Analytics integration for simple visualizations.
4. D3.js
- Overview: D3.js (Data-Driven Documents) is a JavaScript library used to create custom, dynamic, and interactive visualizations directly in web browsers. It is highly flexible and capable of producing complex visualizations.
- Key Features: Full customization, integrates with web standards (HTML, SVG, CSS), and supports complex data manipulation.
- Best For: Developers or technically skilled users who need highly customizable and interactive visualizations.
5. QlikView/Qlik Sense
- Overview: Qlik offers two main products: QlikView and Qlik Sense. QlikView is for guided analytics and dashboards, while Qlik Sense is more modern and focuses on self-service analytics.
- Key Features: Associative data model, AI-powered insights, drag-and-drop visualization, and mobile-friendly dashboards.
- Best For: Enterprises needing robust, real-time data analysis and businesses focused on self-service analytics.
6. Looker
- Overview: Looker is a business intelligence tool that is part of the Google Cloud suite, providing data exploration and visualization capabilities. It connects directly to databases to help create real-time dashboards.
- Key Features: Real-time reporting, cloud-based, strong integration with Google Cloud, and customizable visualizations.
- Best For: Cloud-based data visualization and businesses already using Google Cloud products.
7. Plotly
- Overview: Plotly is an open-source graphing library for Python, R, and JavaScript that creates interactive charts and dashboards. Plotly also offers a paid enterprise version.
- Key Features: Highly interactive visualizations, real-time data analysis, and compatibility with Python, R, and JavaScript.
- Best For: Data scientists, analysts, and developers working with Python or R who need interactive visualizations.
8. Grafana
- Overview: Grafana is an open-source platform for monitoring and visualizing data, often used for real-time data dashboards, especially in DevOps environments.
- Key Features: Real-time monitoring, customizable dashboards, and strong support for time-series data and various data sources.
- Best For: IT professionals, DevOps teams, and businesses that require real-time performance monitoring and data visualizations.
9. Matplotlib
- Overview: Matplotlib is a widely used 2D plotting library for Python that allows users to create static, animated, and interactive visualizations. It’s popular in scientific and research fields.
- Key Features: Comprehensive plotting functions, customizable, and works well with NumPy and Pandas.
- Best For: Data scientists and researchers working with Python who need in-depth control over their visualizations.
10. Zoho Analytics
- Overview: Zoho Analytics is a cloud-based business intelligence platform that allows users to create detailed reports and dashboards using data from multiple sources.
- Key Features: Easy drag-and-drop interface, pre-built templates, data blending, and AI-driven insights.
- Best For: Small and medium-sized businesses seeking a comprehensive data analytics solution with visualization capabilities.
11. Sisense
- Overview: Sisense is a business intelligence and data visualization tool that allows users to embed analytics into their applications. It is known for handling large datasets efficiently.
- Key Features: In-chip data processing, embedded analytics, machine learning integration, and customizable dashboards.
- Best For: Enterprises that need to embed data analytics into their products and handle big data efficiently.
12. Chart.js
- Overview: Chart.js is an open-source JavaScript library that allows users to create simple, animated charts and graphs. It’s lightweight and easy to implement for basic visualizations.
- Key Features: Interactive, responsive charts, simple API, and supports 8 chart types (line, bar, radar, pie, etc.).
- Best For: Developers and small projects needing quick, simple data visualizations on websites or apps.
13. IBM Cognos Analytics
- Overview: IBM Cognos is an enterprise-level business intelligence platform offering AI-assisted data visualization and analysis.
- Key Features: AI-driven insights, natural language queries, and predictive analytics integration.
- Best For: Large organizations with complex data needs that benefit from AI and advanced analytics.
14. Kibana
- Overview: Kibana is a free and open-source tool designed to visualize large amounts of data stored in Elasticsearch, often used for log and time-series data analytics.
- Key Features: Real-time data visualization, integration with Elasticsearch, and customizable dashboards.
- Best For: IT operations, DevOps teams, and businesses that need log analysis and monitoring capabilities.
What is the most popular data visualization tool?
The most popular data visualization tool often depends on the specific use case, industry, and user expertise. However, some tools consistently rank as the most popular due to their versatility, ease of use, and powerful capabilities. Among these, Tableau and Power BI stand out as the leading choices for most users.
1. Tableau
- Why It’s Popular: Tableau is widely regarded as one of the most powerful and flexible data visualization tools. It allows users to create interactive, highly customizable visualizations and dashboards without needing to write complex code. Tableau’s strong integration with various data sources, including databases, spreadsheets, and cloud services, makes it a go-to tool for many businesses.
- Best For: Businesses, data analysts, and professionals who need to handle large datasets and create detailed, interactive dashboards.
- Strengths: User-friendly interface, drag-and-drop functionality, real-time data processing, and robust community support.
2. Power BI
- Why It’s Popular: Power BI, developed by Microsoft, is another widely popular tool for data visualization and business intelligence. Its seamless integration with Microsoft Office and other enterprise tools makes it a favorite among businesses that are already in the Microsoft ecosystem. It offers both free and premium versions, making it accessible for a range of users from small businesses to large enterprises.
- Best For: Users who work within the Microsoft ecosystem, small to medium businesses, and enterprises looking for a cost-effective BI tool.
- Strengths: Cost-effective, real-time reporting, easy integration with Microsoft products, and advanced analytics features.
Other Popular Tools:
- Google Data Studio: Popular for its ease of use, especially for users familiar with the Google ecosystem (Google Analytics, Google Sheets). It’s free and highly accessible.
- Qlik Sense: Known for its data discovery capabilities and associative data engine, which allows users to explore data relationships easily.
- D3.js: Popular among developers for creating highly customized and interactive data visualizations in web browsers.
Tableau and Power BI are two of the most popular data visualization tools globally, each with its strengths. Tableau is known for its powerful and flexible visualization capabilities, while Power BI is favored for its cost-effectiveness and integration with Microsoft products. The choice between them often depends on user needs, technical expertise, and business requirements.
Is SQL a visualization tool?
No, SQL (Structured Query Language) is not a data visualization tool. It is a programming language used for managing and querying relational databases. SQL allows users to retrieve, manipulate, update, and organize data stored in databases, but it does not natively provide features for creating visualizations like charts or graphs.
How SQL Is Related to Data Visualization:
While SQL itself isn’t a visualization tool, it plays a key role in the data visualization process by preparing and retrieving the data that visualization tools use. Many data visualization tools integrate with SQL databases to pull data and create visual representations like charts, graphs, and dashboards.
SQL in the Data Visualization Workflow:
- Data Querying: SQL is used to query and fetch specific data from databases.
- Example: You can write an SQL query to extract sales data from a database for a specific time period.
- Data Preparation: Before visualizing, SQL helps in filtering, aggregating, or transforming data (e.g., calculating averages, summing values).
- Example: An SQL query could aggregate total sales by month, making it easier to visualize monthly trends.
- Data Transfer to Visualization Tools: After the data is prepared, it can be sent to a visualization tool like Tableau, Power BI, or Google Data Studio for creating visualizations.
- Many visualization tools offer direct integration with SQL databases, allowing users to import data from SQL databases to build charts and dashboards.
Common Data Visualization Tools That Use SQL:
- Tableau: Allows users to connect to SQL databases and run SQL queries to fetch data for visualization.
- Power BI: Supports SQL Server and other SQL databases for pulling data into its visualization dashboards.
- Looker: A business intelligence tool that heavily relies on SQL to model and visualize data.
Is Excel a data visualization tool?
Yes, Excel can be considered a data visualization tool, though it is primarily known for its spreadsheet and data analysis capabilities. Excel includes various features for creating visual representations of data, such as charts, graphs, and pivot tables, making it a popular choice for basic data visualization.
Data Visualization Features in Excel:
- Charts and Graphs:
- Excel allows users to create a wide range of visualizations, including bar charts, pie charts, line graphs, scatter plots, histograms, and more.
- Users can customize these charts by adding labels, legends, colors, and other formatting options to make the data easier to interpret.
- Pivot Tables and Pivot Charts:
- Pivot tables allow users to quickly summarize and analyze large datasets, and pivot charts provide a dynamic way to visualize this summarized data.
- Pivot charts are linked to pivot tables, making them a powerful tool for exploring data relationships and trends interactively.
- Conditional Formatting:
- Excel’s conditional formatting feature allows users to highlight data patterns using color scales, data bars, and icon sets, making it easier to visualize key trends and outliers directly within the spreadsheet.
- Sparklines:
- Sparklines are small, simple line graphs that can be embedded into individual cells, allowing users to add visual context to their data without taking up much space.
- 3D Maps:
- Excel also includes a feature called 3D Maps, which lets users create interactive geographical visualizations, making it useful for mapping data with a spatial component (e.g., sales by region).
Limitations of Excel for Data Visualization:
- Complexity: While Excel can handle basic visualizations well, it may not be ideal for large-scale or highly complex visualizations that require advanced customization or interactivity.
- Scalability: For very large datasets or real-time data visualizations, dedicated tools like Tableau, Power BI, or Google Data Studio offer more scalability and flexibility.
- Advanced Visualizations: Tools like D3.js, Plotly, and others offer more sophisticated and interactive visualization options than Excel.
What is a visualization tool?
A visualization tool is software or a platform that allows users to represent data in graphical or pictorial formats such as charts, graphs, maps, or dashboards. The purpose of these tools is to make complex data more understandable, visually compelling, and easier to interpret, allowing users to identify patterns, trends, and insights that might not be immediately apparent in raw data form.
Key Features of Visualization Tools:
- Data Representation: They transform raw data into visual elements like bar charts, pie charts, line graphs, scatter plots, heatmaps, and geographical maps.
- Interactivity: Many tools allow users to interact with the data by filtering, zooming, or drilling down into specific details.
- Customization: Visualization tools often provide customization options, such as choosing colors, labels, annotations, and formatting to enhance the clarity of the visual representation.
- Data Integration: Most tools support integration with various data sources like databases, spreadsheets, APIs, and cloud services, enabling real-time data visualization and analysis.
- Automation: Some tools allow for automated data updates, meaning visualizations can be refreshed automatically as new data becomes available.
- Dashboards: Many tools provide the ability to create dashboards, which are collections of multiple visualizations, often used for real-time monitoring or executive reporting.
What are the 4 main visualization types?
The four main types of data visualizations cover different ways of representing data to suit various analytical needs. These categories help in effectively communicating trends, comparisons, distributions, and relationships within data:
1. Charts
Purpose: To show trends, comparisons, and parts of a whole.
Examples:
- Line Chart: Displays trends over time, often used for time series data (e.g., stock prices, sales figures).
- Bar Chart: Compares different categories or items.
- Pie Chart: Shows proportions of a whole, often used for categorical data.
2. Graphs
Purpose: To represent relationships and distributions in data.
Examples:
- Scatter Plot: Shows the relationship between two variables to identify correlations or patterns.
- Histogram: Displays the frequency distribution of a dataset, often used for understanding how data is spread across intervals.
3. Maps
Purpose: To represent data in a spatial context, often showing geographic relationships or distributions.
Examples:
- Choropleth Map: Uses color shading to show values across regions or locations (e.g., population density, election results).
- Heatmap: Uses color gradients to represent data values, often applied to geographic or tabular data.
4. Tables
Purpose: To present data in a structured, detailed format for easy lookup and reference.
Examples:
- Pivot Tables: Summarize and organize large datasets, allowing for comparisons and grouping.
- Simple Data Tables: Display raw data in rows and columns for detailed reporting.
What are the big data visualization tools?
Big data visualization tools are designed to handle and visualize large, complex datasets that traditional tools may struggle to process. These tools help organizations analyze vast amounts of data in real time, uncover insights, and make data-driven decisions. Here are some of the most popular big data visualization tools:
1. Tableau
- Overview: Tableau is a leading data visualization tool that excels in handling large datasets, offering real-time analytics and interactive dashboards. It connects to big data platforms like Hadoop, Amazon Redshift, and Google BigQuery, making it a top choice for visualizing big data.
- Key Features: Real-time data processing, scalability, drag-and-drop interface, extensive data source integrations, and easy sharing of visualizations.
- Best For: Enterprises needing robust visualizations and interactive dashboards for large datasets.
2. Power BI
- Overview: Microsoft Power BI provides strong big data visualization capabilities through its integration with Azure, SQL Server, and other big data sources. It’s known for its user-friendly interface and seamless integration within the Microsoft ecosystem.
- Key Features: Real-time analytics, integration with big data sources like Azure Data Lake, customizable dashboards, and AI-driven insights.
- Best For: Businesses using Microsoft products, small to medium enterprises, and big data reporting.
3. Qlik Sense
- Overview: Qlik Sense is a self-service data visualization tool known for its associative data model, which helps users explore big data interactively. It integrates well with big data platforms and enables users to uncover hidden relationships within large datasets.
- Key Features: Associative data engine, AI-powered insights, real-time data processing, and customizable dashboards.
- Best For: Enterprises that need to explore complex relationships in big datasets.
4. D3.js
- Overview: D3.js is an open-source JavaScript library that enables highly customized and interactive data visualizations, especially for big data projects. While it requires coding skills, it offers full control over how data is visualized.
- Key Features: Full customization, ability to handle large and complex datasets, and integration with web technologies (HTML, CSS, and SVG).
- Best For: Developers and data scientists who need custom visualizations for large, complex datasets.
5. Apache Superset
- Overview: Superset is an open-source big data exploration and visualization platform developed by Airbnb. It is designed for modern data workflows and integrates with big data frameworks like Apache Hadoop, Apache Druid, and Presto.
- Key Features: Interactive dashboards, scalable for large datasets, support for multiple data sources, and built-in data exploration features.
- Best For: Organizations that need an open-source tool for visualizing large-scale data.
What is big data visualization?
Big data visualization refers to the process of graphically representing large, complex datasets in a way that makes it easier to identify trends, patterns, correlations, and insights. It helps users interact with and understand vast amounts of data, often in real-time, which would be too difficult to interpret using traditional data analysis methods. Big data visualization typically involves dynamic and interactive visual elements such as charts, graphs, maps, and dashboards that can handle the size and complexity of big data.
Key Characteristics of Big Data Visualization:
- Handling Volume, Variety, and Velocity:
- Big data visualization is designed to manage the large volume of data, the variety of data types (structured, unstructured, or semi-structured), and the velocity at which data is generated, such as real-time streaming data.
- Scalability:
- Visualization tools for big data are scalable, meaning they can handle increasing amounts of data as the volume grows, often relying on cloud computing or distributed data storage to process and visualize data efficiently.
- Real-Time Analytics:
- Many big data visualization tools provide real-time or near-real-time data visualizations, allowing organizations to monitor ongoing events, performance metrics, and trends as they happen.
- Interactivity:
- Big data visualizations often include interactive elements such as filters, drill-downs, and dynamic updates, enabling users to explore and manipulate the data for deeper insights.
- Complex Data Representation:
- Big data is not just large in volume but often comes from multiple sources and in different formats. Visualization tools must be able to represent complex datasets, including unstructured data like text, images, or social media content.
Is Hadoop a data visualization tool?
No, Hadoop is not a data visualization tool. Hadoop is an open-source framework used for storing and processing large datasets in a distributed computing environment. It is primarily designed to handle big data by distributing the data across multiple servers (nodes) and processing it in parallel using a framework called MapReduce.
Key Functions of Hadoop:
- Distributed Storage (HDFS): Hadoop’s Hadoop Distributed File System (HDFS) allows it to store massive datasets across many nodes in a cluster, ensuring fault tolerance and scalability.
- Data Processing (MapReduce): Hadoop uses the MapReduce programming model to process large datasets in parallel across multiple nodes, speeding up data analysis and computation.
- Data Management: Hadoop provides a foundation for other big data tools to work on top of, such as Hive (SQL-like querying) or Pig (data transformation), to make working with large datasets easier.
How Hadoop Relates to Data Visualization:
- While Hadoop is used to store and process large-scale data, it does not provide visualization capabilities on its own. However, Hadoop can work with data visualization tools that are built to extract and visualize the data stored or processed in a Hadoop environment.
Common Data Visualization Tools Used with Hadoop:
- Tableau: Can connect to Hadoop through connectors like Hive, allowing users to visualize big data processed by Hadoop.
- Power BI: Supports integration with Hadoop ecosystems, enabling visualization of large datasets stored in HDFS.
- Qlik Sense: Integrates with Hadoop clusters, making it easier to explore and visualize big data.
- Apache Superset: An open-source visualization tool that can integrate with Hadoop to provide interactive dashboards for big data analysis.


