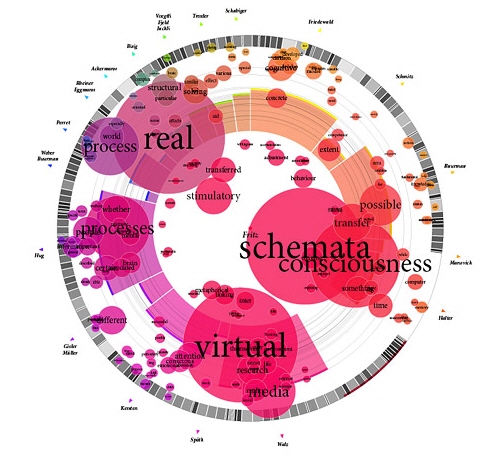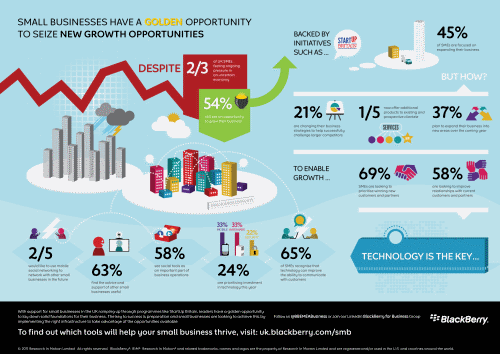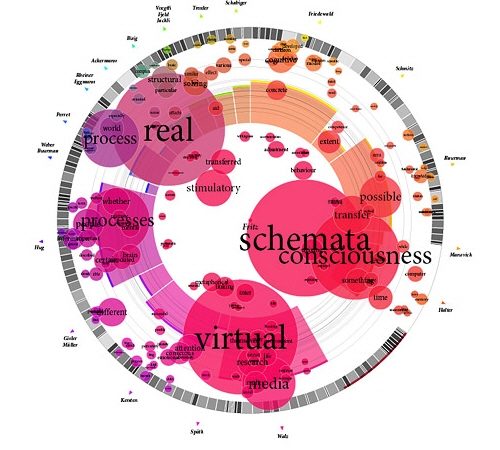
In a data-driven world, Data Visualization is the future, enabling big data to explore its true potential. Data Visualization refers to representing data visually effectively so as to communicate information clearly using graphical interpretation. The ideas need to be conveyed effectively using form as well as functionality.
In the past, data visualization was mostly limited to bar charts, graphs and pie charts but now it is becoming more innovative and expressive with user interactions and use of 3D images. A good example can be seen here: GE blog post – visualization of GE’s 120 annual reports.
The Big Data Effect
Big Data is transforming work culture within an organization. It is setting a culture in which businesses must join hands together with IT professionals to explore value from varied data sources. With an increase in demand for insights, an innovative approach is required to deal with rising demands of data visualization tools.
Big Data insights are helping businesses to:
- Improve relationship with customers
- Optimize operations
- Make smart business decisions
- Enhance ROI
Today, Big Data is being generated at an alarming rate from varied sources, but not limited to, mobile devices, systems, sensors as well as social media websites. With the rise in popularity of Big Data, most business enterprises are increasingly becoming aware of the concept. Optimal processing power along with capabilities of effectively employing the analytics is being used to extract meaningful value from big data. Several companies are offering Web crawling, web scraping and data extraction services, turning this process fast and automated.
Business executives are looking for more data visualization tools to help them support their insight and enhance their understanding of major business drivers. This is going to transform the scenario of analysts working with data. These analysts need to accelerate their understanding of insights and analyze data creatively.
Today data-driven interaction is becoming the need of the hour. Companies are using Data Visualization tools for data extraction and e-commerce data feed extraction. For instance, Facebook and Twitter are employing dataviz (Data Visualization) techniques to offer users information as per their preferences.
In past few years, development in Data Visualization has made it possible for enterprises to harness the Data Visualization potential at a competitive pricing. As a result, not only large enterprises but SMEs and start-ups are adopting dataviz tools to unleash its advantages.
The Future of Data Visualization can be anticipated in more sophisticated algorithms to simulate and predict the user preferences in order to provide much more efficient, visually appealing and relevant data graphics. Analysts will mine data as users interact with website and understand their patterns of interaction offering them better visualization designs. These more efficient visualization designs will lead to more satisfied customers.
In the future of Data Visualization, companies will be making smarter business decisions based on the analysis and models in minutes rather than hours. Visualization techniques will help companies explore a very large number of data points and data sets to ask questions they never did earlier. Data Visualization tools will represent big data in a way that will be simple enough to be grasped by an audience not trained on data analysis and interpretation. At the same time, the simplicity of data visualization will empower the users to comprehend extraordinary analytics and reap the benefits.
The adoption of data visualization will be widespread, leaving no business line or industry that would like to harness the information based on historical trends and patterns. It will become almost essential to employ dataviz tools to innovate, solve problems, and grow businesses.
Few Popular Data Visualization Software
Instant Atlas
Instant Atlas creates highly interactive and engaging data visualizations using statistics and map data to create engaging data visualizations.
Modest Maps
A simple mapping tool, it enables web designers to integrate and develop interactive maps within a site.
Better World Flux
Better World Flux aims to bring positive change to the world. A highly informative tool for those interested on writing about Poverty, Personal Hygiene, and Malnutrition among other similar subjects as well.
Timeline
Timeline creates captivating interactive visualizations. It is an astonishing widget which conveys tremendous information in a compressed space. Each element reveals more information being clicked upon, also ensuring a greater in-depth detail.
Dygraphs
Dygraphs is an open source JavaScript Library that enables users to understand and explore dense data sets. This is a customizable tool that works on all major browsers and can even be browsed on mobiles and tablets.
Many Eyes
This tool was developed by IBM to develop visualizations quickly from datasets uploaded by the public. It offers extensive analysis based on keyword density and saturation.
Leaflet
Leaflet is a mapping tool making OpenStreetMap data simple to use. It incorporates fully interactive data visualization in an HTML /CSS3 wrapper.The core library is small but possesses varied plug-ins which extend functionality with specialist functionality.
WolframAlpha
WolframAlpha, also known as “computational knowledge engine”,displays charts with respect to data queries without the requirement for any configuration. It offers an easy widget builder to get visualizations on your site.
Visual.ly
Visual.ly offers a simple toolkit for building amazing data representations. It is an infographic generation tool for creating amazing data representations.


