The American job market is showing an upswing both in terms of job growth and wage.
However, if we look at the US jobs report, it is not the number of new jobs created or the declining unemployment rate that get the limelight, it is the enigma behind the American salary that get the coverage. For almost a decade, salary in the U.S. market did not reciprocate to the growing US economy (after the 2007-08 financial crisis) and the soaring stock market.
This August, we started receiving positive news for the American workers in terms of paycheck. Although the Federal Reserve will possibly encounter tough time owing to price rise before the expected timeline, this wage growth along with lowest unemployment rate (3.7%) will definitely make companies more competitive for talent acquisition. Here we should also note that salary has not increased in a coherent manner to match it across industries (barring key industries, such as tech), which has possibly led to low-high wage discrepancies according to data published by CareerBuilder.
It is quite palpable that in the tight talent market, employers can focus more on employee development practices. Since, nearly 50% employees are not sure about the future direction of their career, it is a win-win situation for both employees and employers. Companies can help their employees by upskilling them for challenging opportunities within the company which can cut down recruitment from outside. And at the same time it will help employees get better wage.
In this study, we are presenting the changes projected in the report shared by CareerBuilder based on wage growth for the following three fast-growing categories of job:
– low-wage job (pay less than $14.17 or less per hour)
– middle-wage job ($14.18-$23.59 per hour)
– high-wage job (more than $23.24 per hour)
Number of Jobs [2018 VS. 2023]
We can see that in high-wage, middle-wage and low-wage jobs, most number of jobs would come from ‘registered nurses’, ‘customer service’ and ‘retail salesperson’ respectively. T
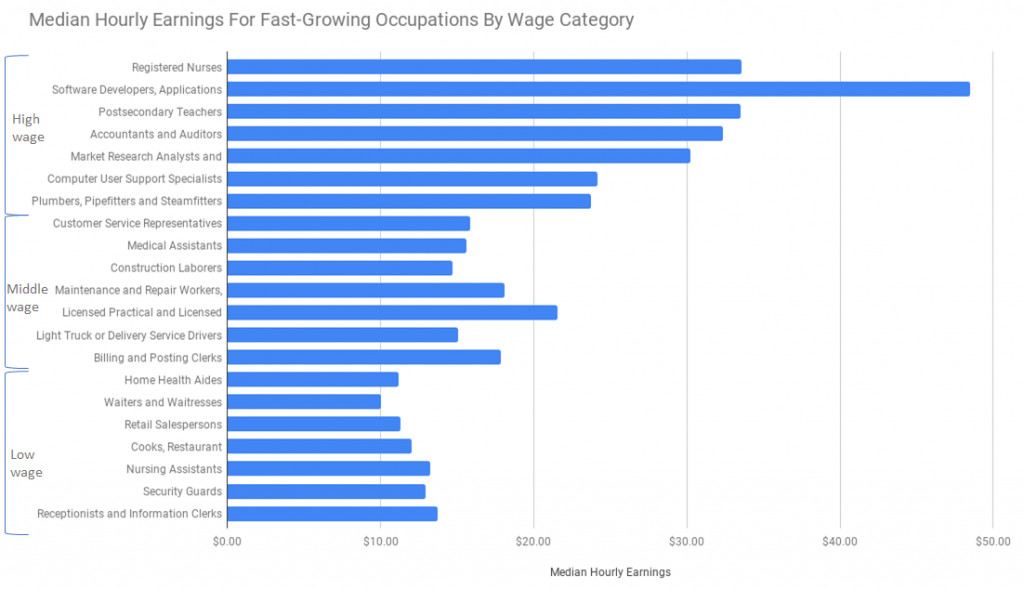
Median Hourly Earnings
Let’s now look at the earning data.
Of course, software developers are the ones who are paid the highest. And this also proves the high demand in the STEM field. Apart from this occupation, we see that ‘registered nurses’, ‘postsecondary teachers’ are the highest earners in the high-wage category. In the low-wage and middle-wage segment, ‘Licensed Practical and Licensed Vocational Nurses’ and ‘Receptionists and Information Clerks’ are the highest earners in their category.
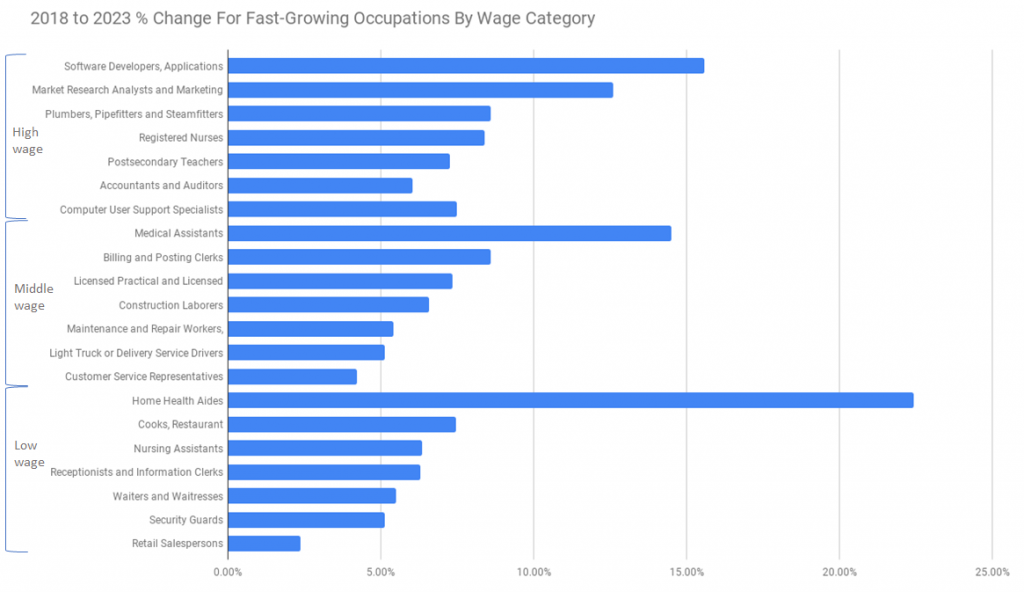
% Change For Fast-Growing Occupations
Now, we’ll look at the maximum percentage change in the job growth.
Again, there is going to be surge in demand for software developers in the high-wage sector. In the other two categories, ‘Medical Assistants’ and ‘Home Health Aides’ would witness maximum growth. In fact, at 22.42%, ‘Home Health Aides’ occupation will be registering the highest growth among all the jobs.
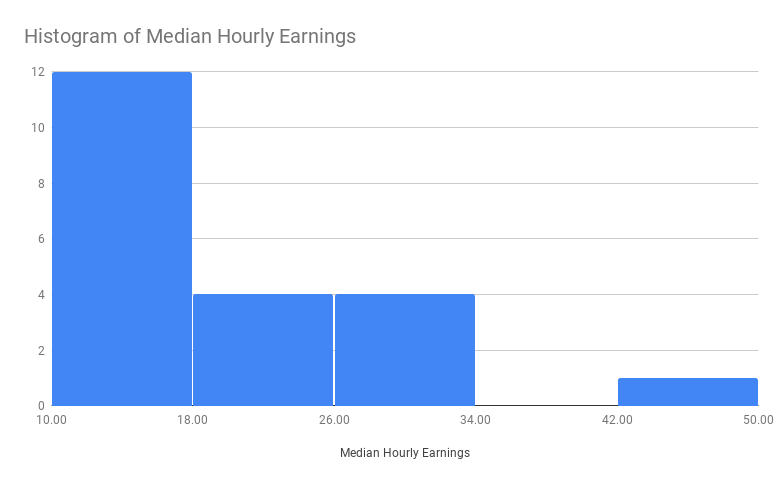
Histogram of Median Hourly Earnings
Finally, let’s check out the salary distribution across all the jobs.
The above histogram that more than 55% of the jobs listed in this study fall in the $10-$18 segment. Only software developers are the ones in the $42-$50 category with $48.49 hourly wage.
This brings us to the end of the data visualizations for the projected U.S. job market. Let’s know about your thoughts on the future market and the insights you see from these charts in the comments.


![Number of Jobs [2018 VS. 2023]](https://www.promptcloud.com/wp-content/uploads/2018/10/Number-of-Jobs-2018-VS.-2023-1024x632.png)


